Canada's GHG Emissions Changes from 1990-2015. See paragraph on right for explanation.
Greenhouse gases from human activities are the most significant driver of climate change globally, since the mid-20th century. Here's a visualization of Canada's emissions trends from 1990-2015.
Learn MoreData Source
Climate Change is undoubtedly one of the significant global environmental issues of this time. The impacts of climate change are seen to be a threat in environmental, social and economic perspectives; as it leads to extreme weather, sea level rises, global warming and many more environmental issues. Over the years, these issues have shown a steady increase, which greatly impacts human habitat at a global capacity. While various elements influence the effects of climate change, Greenhouse Gas (GHG) Emissions are noted to be one of the highest contributors. Below is an evaluation of Canada's GHG emissions contribution at various scales, and evaluating its future trajectory.
Over the years, the GHG emissions in Canada show an inevitable increase. The sequential increase map on the left shows the changes of emissions from 1990 to 2015; with 1991 being the lowest amount of emissions with 604 megatonnes of carbon dioxide equivalent (lightest -white) and 2004 being the highest amount of emissions with 751 megatonnes of carbon dioxide equivalent (darkest -orange/burgundy). Between 1990 and 2015, the emissions show an increase of approximately 20%. Globally, Canada's emissions contribution made up 1.6% in 2013.
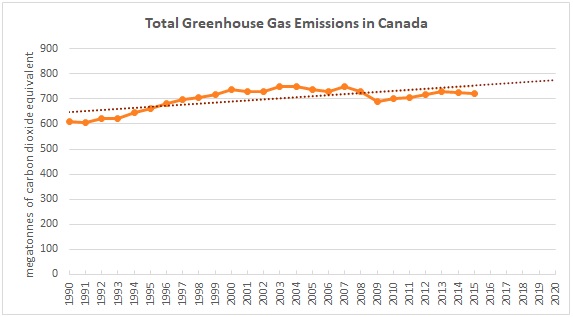
As seen in the graph on the right, since 2012, the emissions show a declining trend. This decline could be understood by the gradual coal phase out and the decrease of emissions in the electricity generation sector. Yet, considering the trajectory since 1990, the trend shows an increase over the next five years. Under the Paris Agreement, Canada has committed to reducing its GHG emissions footprint by 30% below 2005 levels (738 megatonnes of carbon dioxide equivalent) by the year 2030. To this day, the overall emissions have reduced by approximately 4% since 2005.
.gif)
Regionally, the Canadian emissions have varied by province and territory. As seen in the map on the left, the territorial emissions have remained rather constant over the years between 1990 and 2015. The territories accounted for approximately 0.5% of the emissions in 2015, which was the lowest emitted. Alberta and Ontario are seen to be the provinces with the highest emissions, with Alberta accounting for 38% of emissions and Ontario accounting for 23% of the emissions in 2015. As in the map, British Colombia and Saskatchewan show a increase in emissions since 1990. In 2015, the top 5 emitting provinces (Alberta, Ontario, Quebec, Saskatchewan and British Columbia) released approximately 90% of Canada's national total GHG emissions combined.
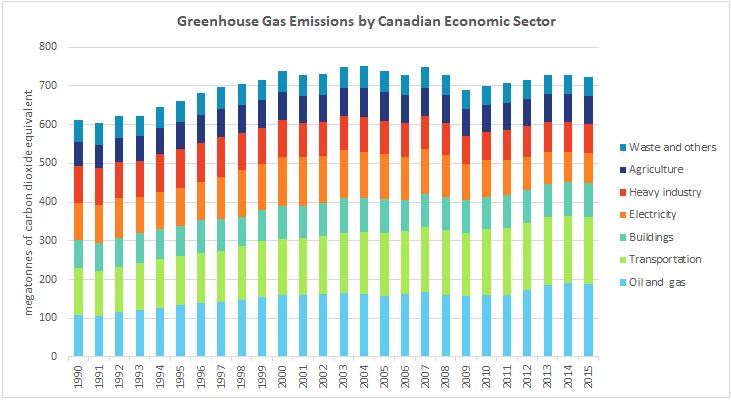
While various economic sectors contribute to GHG emissions, the oil and gas sector as well as the transportation sector are seen to be the two highest contributors. In 2015, the oil and gas sector accounted for 26% of emissions and the transportation sector accounted for 24% of the national emissions -which is over 50% of the Canadian emissions. The oil and gas sector alone has increased over 70% since 1990 and continue to show an increasing trend.